Using Reports
The Reports tab gives you visibility into box office performance across your productions. Whether you're checking daily results, analyzing a single release, comparing productions, or reviewing all-ti…
The Reports tab gives you visibility into box office performance across your productions. Whether you're checking daily results, analyzing a single release, comparing productions, or reviewing all-time performance, the four views let you examine your data from different angles. Many users also export from these views and continue analysis in Excel or other tools — a natural and supported workflow.
Table of Contents
By Day
The By Day view is your primary tool for checking daily box office results. Use this view when you need to monitor current performance, compare productions side by side, or identify regional patterns.
Navigate to Reports → By Day (the default Reports landing page).
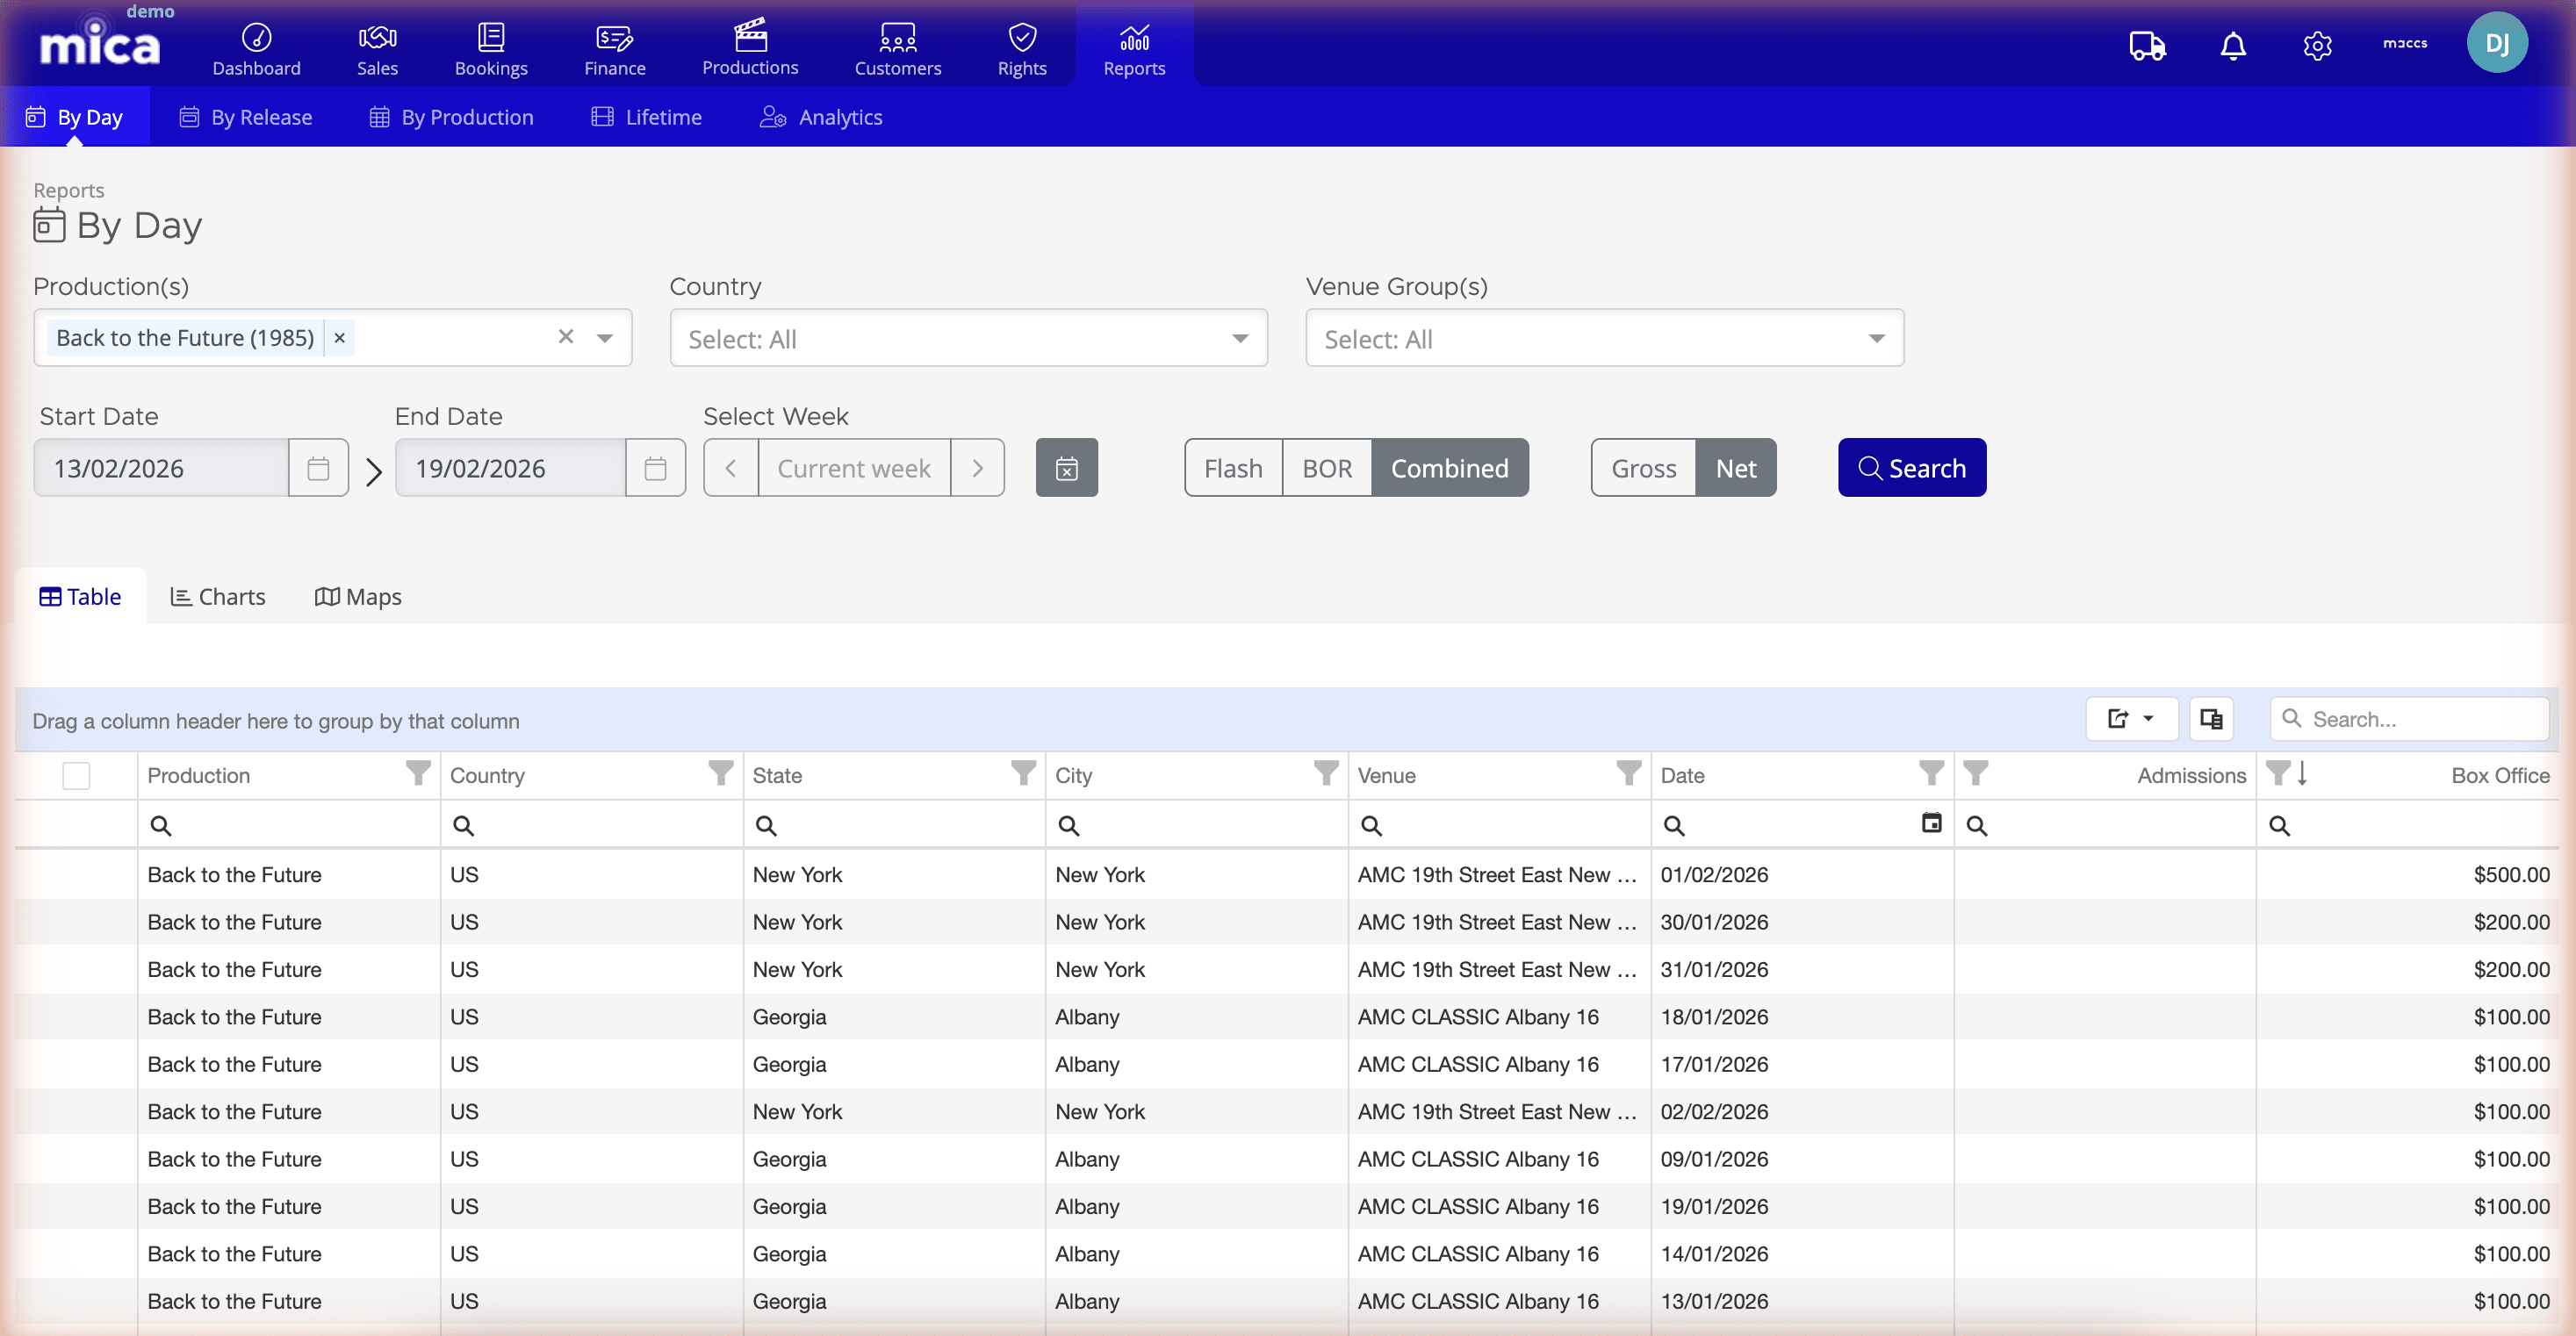
Filtering and Display Options
You can narrow down the data you're looking at using these filters:
- Production(s) — Select one or multiple productions to compare their performance
- Country — Filter by country where the venues are located
- Venue Group(s) — Narrow to a specific chain or circuit
- Start Date and End Date — Set your date range
- Select Week — Navigate directly to a specific week
Once you've set your filters, choose which metrics to display:
- Current week — Limit the view to the current week's data
- Flash — Preliminary, unreconciled box office figures — typically available sooner than BOR
- BOR (Box Office Return) — View confirmed, reconciled figures from exhibitors
- Combined — Display both Flash and BOR data together for comparison
- Gross and Net — Toggle between gross and net revenue
Viewing Modes
The By Day view offers three ways to examine your data:
- Table — A detailed spreadsheet-style view with columns for Production, Country, State, City, Venue, Date, Admissions, and Box Office. You can use the Column Chooser to show/hide columns and drag columns to group by Production, Venue Group, or other fields.
- Charts — Visual graphs of your box office trends
- Maps — Geographic visualization of venue performance across regions
By Release
The By Release view is designed for detailed analysis of a single release. Use this when you want to understand how a specific release performed week over week, compare different versions or venue groups, or prepare data for reporting.
Navigate to Reports → By Release.
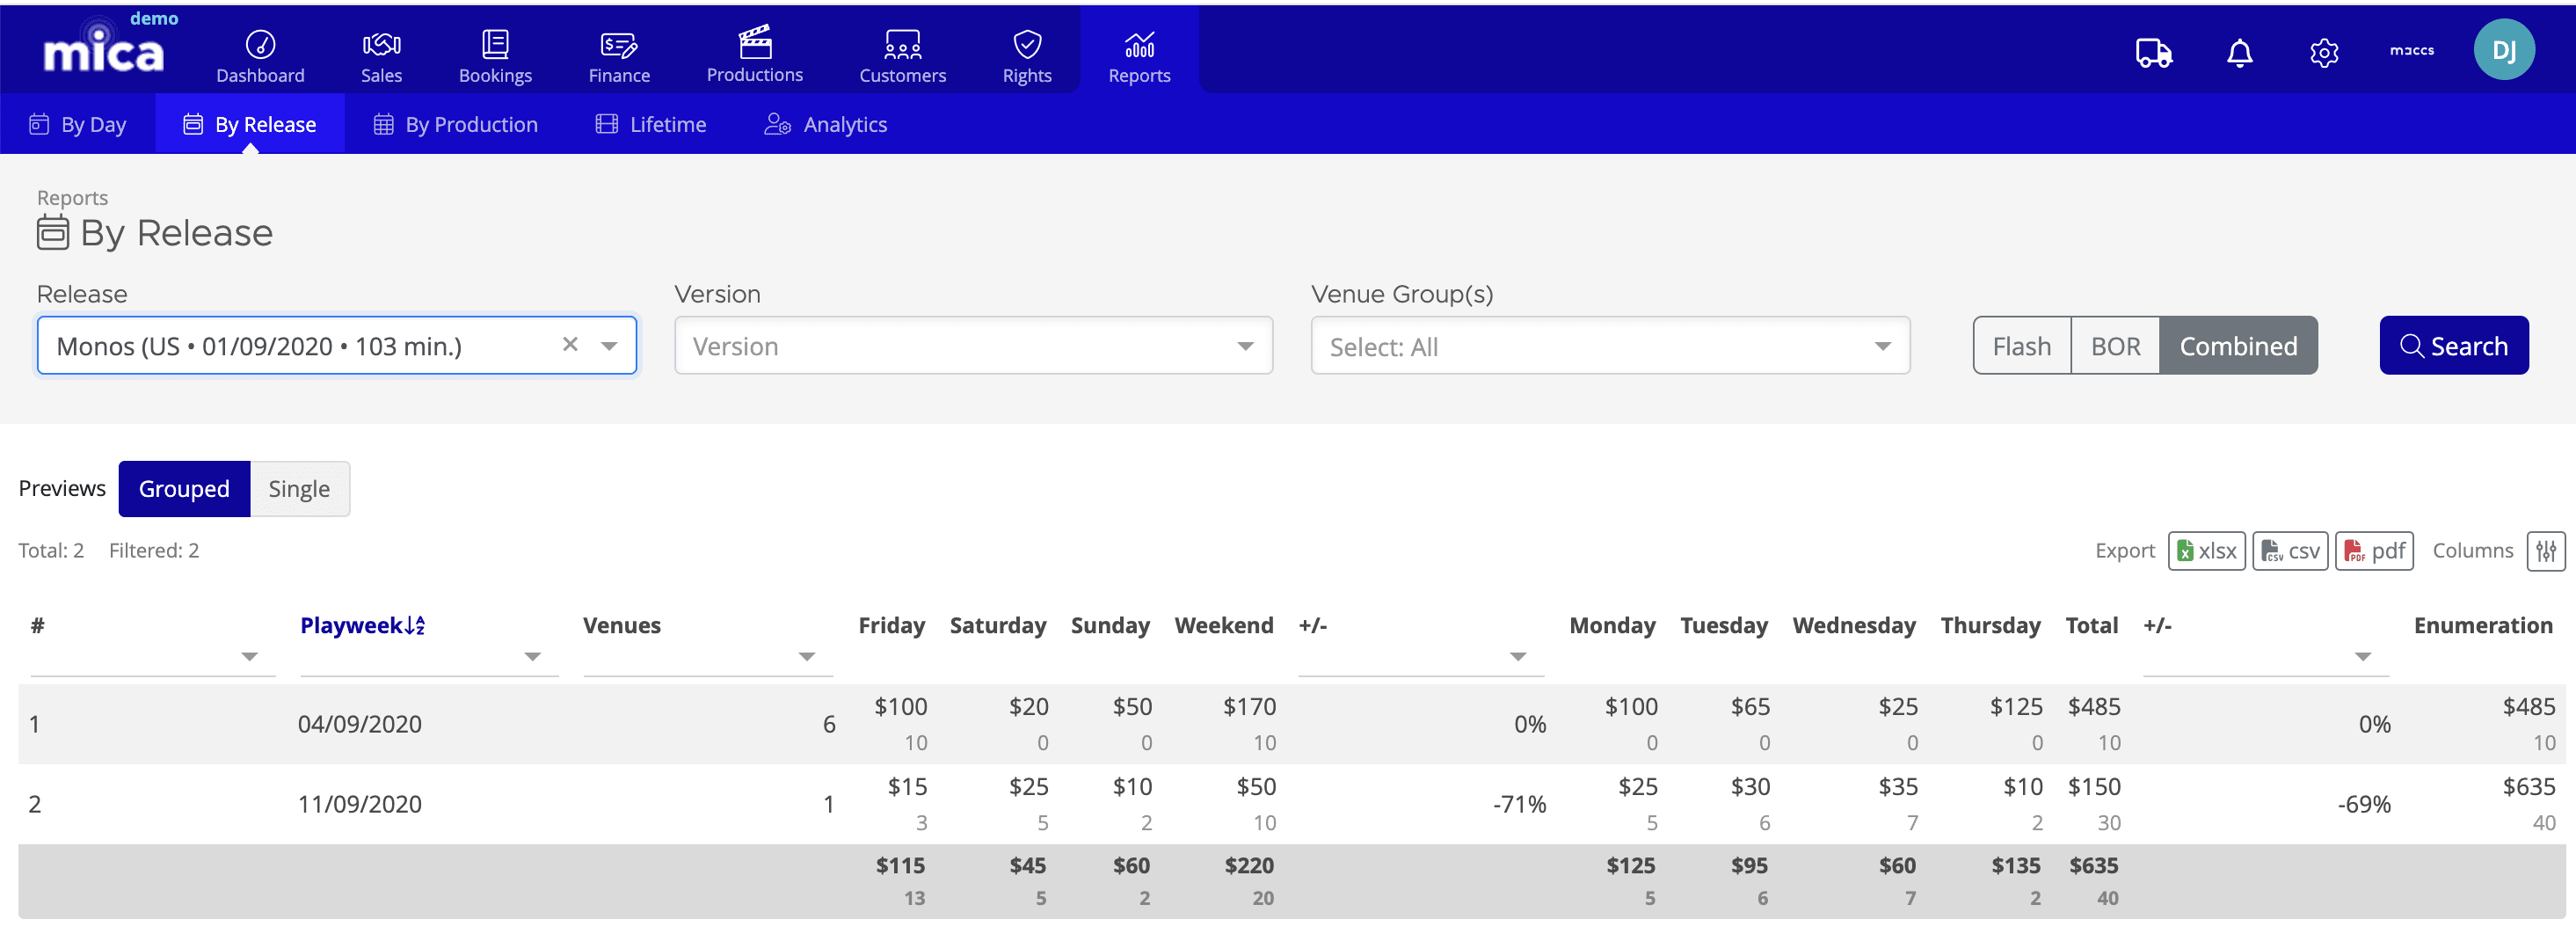
Release View Filters
Start by selecting:
- Release — Choose the specific release you want to analyze
- Version — Filter to a particular cut or format (if applicable)
- Venue Group(s) — Limit results to one or more venue chains
Then choose your display options:
- Flash — Preliminary data
- BOR — Confirmed data from exhibitors
- Combined — Both Flash and BOR
And select your view style:
- Previews — Include preview/preview week data
- Grouped — Aggregate data by Playweek
- Single — Show individual results without grouping
Release Table Layout
The table displays playweek-by-playweek performance with columns for each day of the week (Friday through Thursday), weekend totals, day-by-day growth indicators, and grand totals. An Enumeration column helps you track which release iteration you're looking at.
From this view, you can Export the entire table as Excel, CSV, or PDF for deeper analysis or sharing with stakeholders.
By Production
The By Production view lets you compare all your productions against each other over a given period. Use this view to identify which productions are generating the most revenue, assess market position, or flag underperforming titles.
Navigate to Reports → By Production.
Filtering and Display
Set a date range using Start Date and End Date to compare performance across a specific period. Then toggle your display metrics:
- Gross — Total revenue before deductions
- Net — Revenue after deductions
- Rental — The distributor's share
Use the Filter/Add/Clear filters buttons to refine your result set further.
Production Table
The table ranks productions by performance (Rank column) and shows Playweek, Venue counts, day-by-day breakdown (Friday through Thursday), Weekend totals, and grand Total. This layout makes it easy to spot top performers and compare average performance per venue.
Like the By Release view, you can export this data for custom analysis.
Lifetime
The Lifetime view shows your all-time top 10 productions. Use this for a high-level overview of your strongest-performing titles, or to provide historical context when planning new releases.
Navigate to Reports → Lifetime.
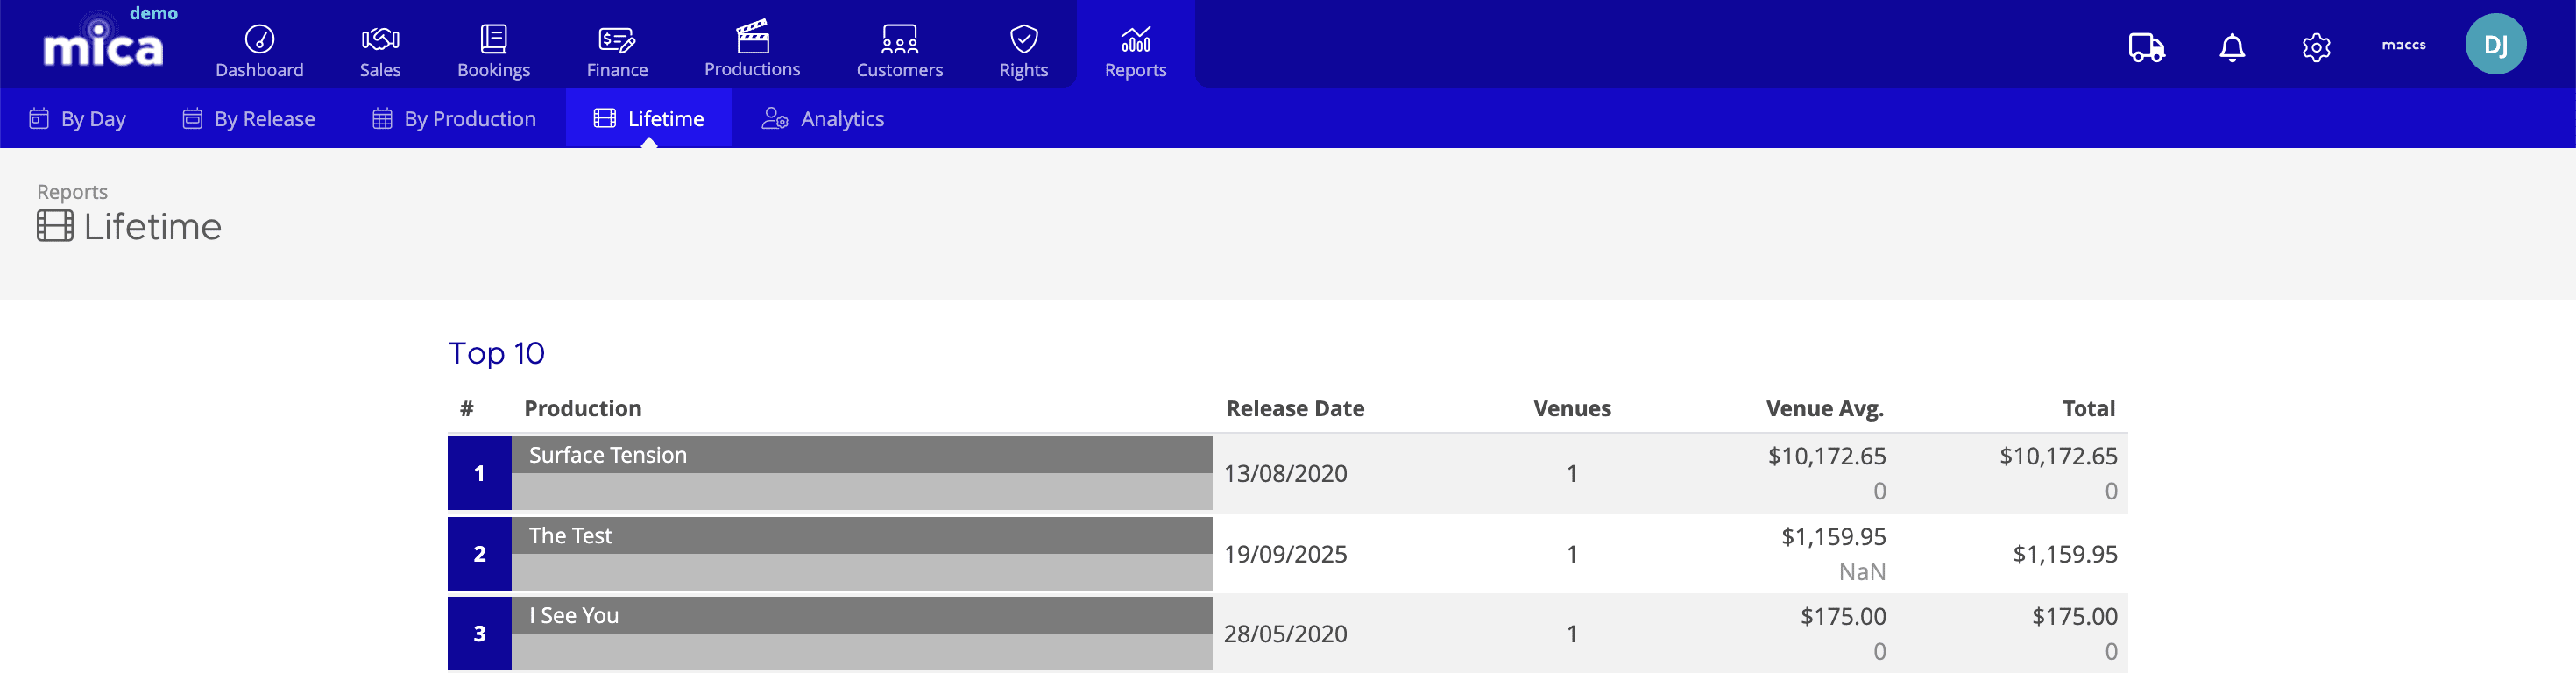
This view displays a ranked table with columns for Rank, Production name, Release Date, number of Venues, Venue Average (revenue per venue), and Total lifetime box office. A Box Office chart visualization shows the relative size of each production's performance, providing a clear visual comparison of relative performance.
Exporting Data
All four Reports views support exporting your filtered data. This is the recommended approach when you need to perform custom calculations, create custom visualizations, or share detailed breakdowns with other teams.
Look for the Export button in the By Release, By Production, and Lifetime views. You can choose to export as:
- Excel (.xlsx) — Preserves formatting and allows further manipulation
- CSV — Plain text format compatible with any analysis tool
- PDF — Ready-to-share report format
Many Mica users export data regularly and continue analysis in Excel, Google Sheets, Tableau, or other business intelligence tools. This is a natural workflow and lets you build custom dashboards tailored to your business needs.
If you need assistance with any aspect of Mica, we're here to help:
Contact your Mica system administrator for organisation-specific questions or access issues
OR
Reach out to the Mica support team at support.mica@maccs.com
How did we do?
Exporting Data from Mica