Production Accounts
Track earnings, collections, and outstanding invoices per production using the Production Accounts view. Covers filtering, key financial columns, aging bucket analysis, collection rate monitoring, and data exports.
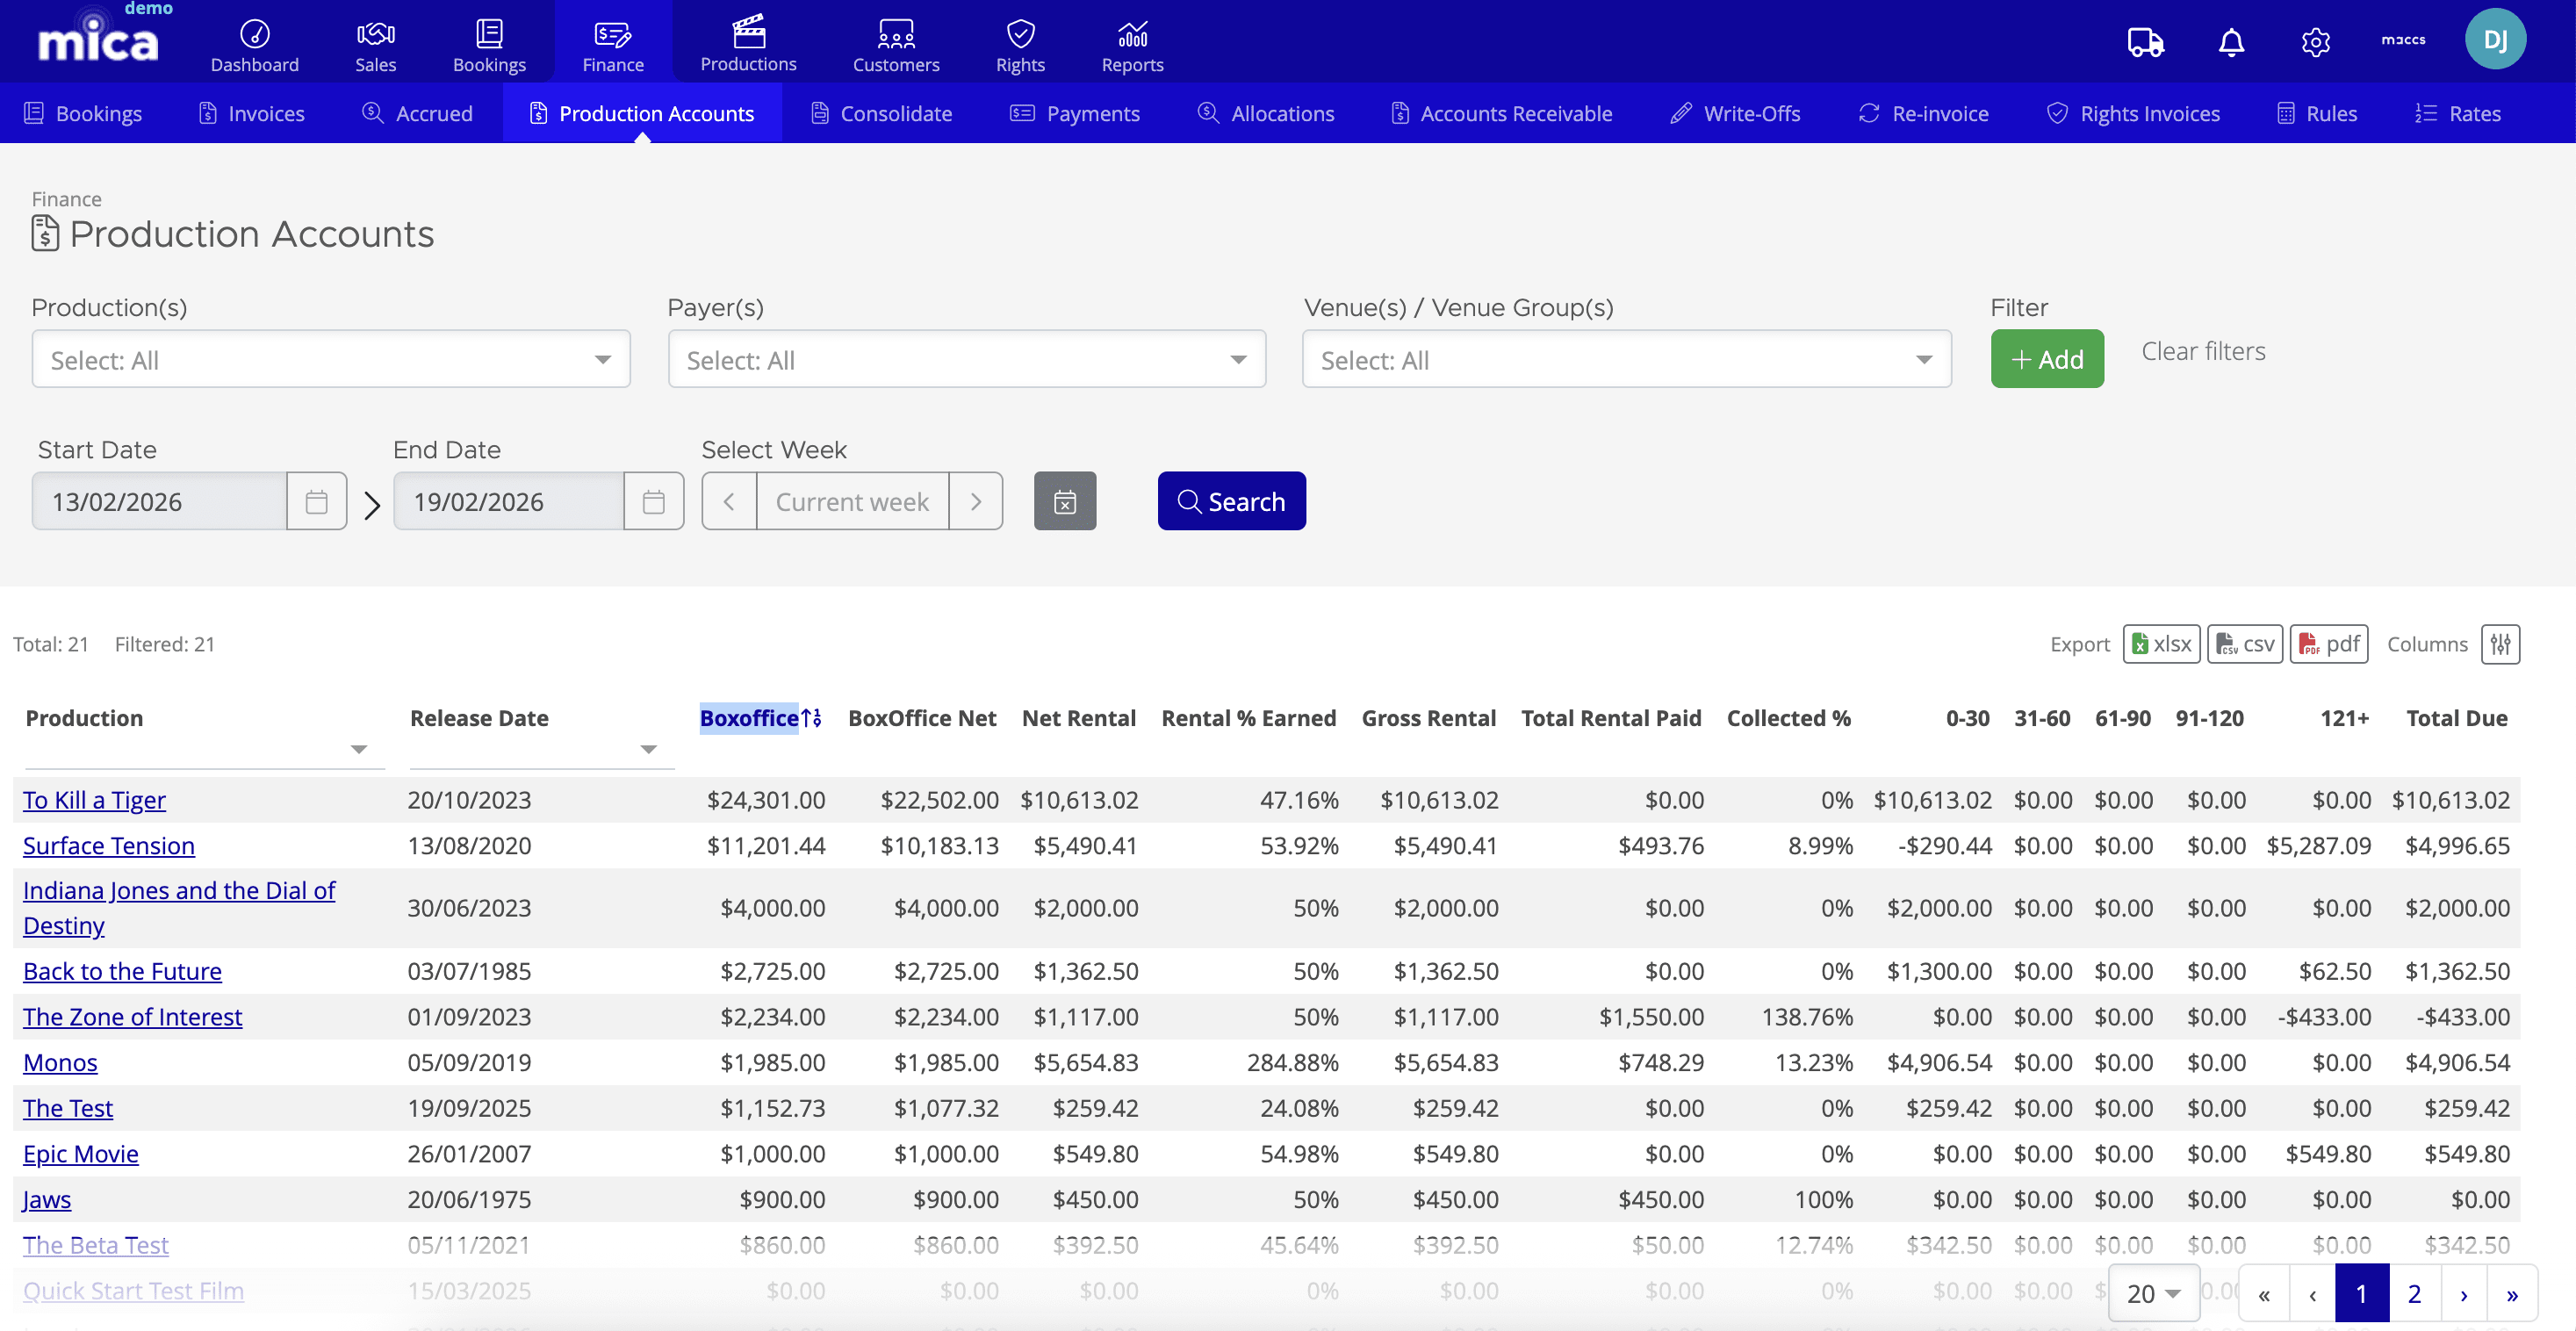
The Production Accounts view provides a financial overview of each production in your catalogue. Found under Finance → Production Accounts, it shows what has been earned, what has been paid, what remains outstanding, and how long invoices have been aging — all in a single table.
Table of Contents
- Why Use Production Accounts?
- Filtering Your Data
- Understanding the Key Columns
- Reading the Data in Context
- Exporting Your Data
Why Use Production Accounts?
Production Accounts is distinct from the box office analytics in the Reports tab. While those views show audience and performance metrics, Production Accounts focuses on invoicing, collections, and outstanding balances. Use this view when you need to:
- Check the financial health of a specific production
- Track collection rates and see how much of your earned rental has actually been paid
- Identify overdue invoices using aging bucket analysis
- Monitor what's still outstanding at a glance
- Export data for further analysis or payment chasing
Filtering Your Data
At the top of the view, you'll find filters to narrow the data by production, payer, and venue:
- Production(s) — Select one or more productions to display. Multi-select allows you to compare financial performance across related titles.
- Payer(s) — Filter by the entity responsible for payment, typically the exhibitor or venue chain.
- Venue(s) / Venue Group(s) — Drill down by individual cinema sites or entire venue groups.
- Start Date & End Date — Set your reporting window using manual date entry.
- Select Week — Navigate directly to a specific playweek or use the Current week toggle for this week's data.
Use the Add button to apply additional custom filters, and Clear filters to reset and start fresh. Click Search to apply your selections.
Understanding the Key Columns
The table displays financial data for each production. Here's what each column tells you:
Production & Timing
- Production — The name of the film.
- Release Date — When the production was released theatrically.
Box Office Data
- Boxoffice — The total gross box office for the production across all venues.
- BoxOffice Net — The box office total after applicable taxes have been deducted.
Rental & Earnings
- Net Rental — Your distributor's share, calculated based on the film's booking terms and split with the exhibitor. This is the amount you're entitled to earn.
- Rental % Earned — Expresses your net rental as a percentage of the net box office. Indicates the effective rental rate across all bookings for the production.
- Gross Rental — Your rental before any deductions or adjustments.
- Total Rental Paid — The amount of rental that has been paid to date.
- Collected % — Shows what percentage of your total earned rental has been collected. A high percentage indicates effective collection; a low percentage indicates significant amounts remain unpaid.
Aging Analysis
The aging columns break down your outstanding invoices by how long they've been unpaid, counting from the invoice due date:
- 0-30 — Days overdue (invoices due within the last 30 days).
- 31-60 — Invoices 31 to 60 days overdue.
- 61-90 — Invoices 61 to 90 days overdue.
- 91-120 — Invoices 91 to 120 days overdue.
- 121+ — Invoices more than 121 days overdue (significantly aged and requiring immediate attention).
- Total Due — The sum of all unpaid rental across all aging buckets.
Reading the Data in Context
A healthy production account typically shows:
- A Collected % approaching 90% or higher (varies by territory and payer type)
- Most aging concentrated in the 0-30 bucket (recent invoices)
- Minimal amounts in 91-120 and 121+ buckets
- A manageable Total Due relative to the production's overall rental earnings
If you notice a production with low Collected % and heavy aging in the 121+ column, this indicates a potential issue worth investigating — check for disputes, outstanding queries, or payers that require follow-up.
Exporting Your Data
Use the Export buttons in the top right to download your filtered report in multiple formats:
- xlsx — Microsoft Excel format, ideal for detailed analysis and pivot tables
- csv — Comma-separated values for integration with other tools or systems
- pdf — Formatted report suitable for printing or sharing with stakeholders
The Columns button lets you customize which columns appear in the export, so you can focus on the metrics that matter most to your workflow.
If you need assistance with any aspect of Mica, we're here to help:
Contact your Mica system administrator for organisation-specific questions or access issues
OR
Reach out to the Mica support team at support.mica@maccs.com
How did we do?
Payment Statuses
Quick Guide: Adding a Xero Reference